|
|
||||||
|
CALTON
and ASSOCIATES ,
INC. Member FINRA, SIPC |
||||||
| Investment & Tax Strategies' |
||||||
| QUAD-RIGA | ||||||
| Managed Asset Program | ||||||
|
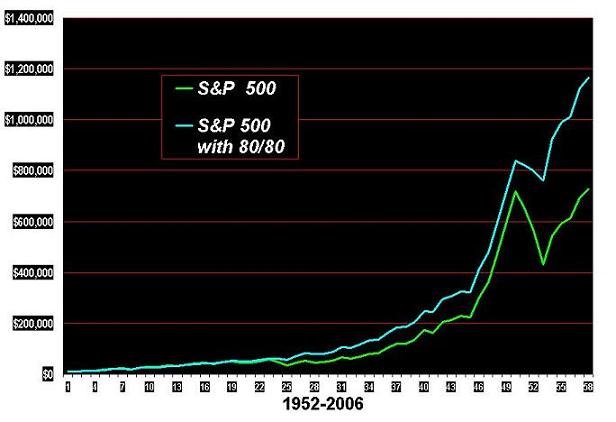
THE 80/80
PRINCIPLE |
|
The chart demonstrates the S&P 500 compared to itself, when on an annual basis, the 80/80 principle is applied. During a positive year, the index is only allowed 80% of the gain, and during a losing year, the index avoids 80% of the loss. The results are of course, a "laboratory" result, and we cannot guarantee that the 80/80 principles can be accomplished in the real world, or that the future results will be similar to historical results. The results do not include trading costs or taxes. The chart in only intended to show the potential merits of the 80/80 philosophies-- that in the opinion of us at Investment & Tax Strategies, Inc., that in the long-term, avoiding large losses is more important than garnishing maximum gains.
|